
Solana dropped to a low of $76 on Thursday, but has since rebounded. The 1-day chart shows that its upward momentum waned, resulting in the decline.
It opened at $79 and peaked at $82, but it faced rejections, resulting in a plunge to its low. However, selling slowed at the mark, and a rebound followed. As a result, the coin ended the session with no significant losses.
Trading conditions have since improved, with SOL trading almost 6% higher than its opening price. It’s gearing up to register its first green on the 1-day chart after five days of consistent decline. The asset opened on Friday at $78 and is trading at $83 at the time of writing. Its current price shows it nearing its three-day high.
As it stands, Solana has erased the losses it incurred over the last two days and may rise in the coming hours as it shows no signs of slowing.
The surge followed the release of crucial economic data by the US BLS. Investors have since flipped bullish as the CPI figures came in better than expected. With signs that inflation is gradually reducing, traders are more optimistic about how the Fed will react.
In response to the massive price hike, the derivative market registered notable liquidations. Over the last 24 hours, traders lost over $16.2 million, with short positions accounting for $9.3 million. Interestingly, most of the liquidated shorts happened in the past 4 hours.
However, with the uptick in full gear, questions about its duration and effectiveness rage.
Will Solana Reclaim $90?
A closer look at the chart shows that the altcoin is trading at a notable level. Following its rebound last Friday, it held on to $83 until Wednesday, when it finally lost it. The bulls defended the mark several times but ultimately lost.
Price action at the mark shows it is important to buyers. Traditionally, when key levels like this flip, the bears stage selling congestion, making it a tough resistance. It remains to be seen if the bulls will decisively break the mark in the coming hours.
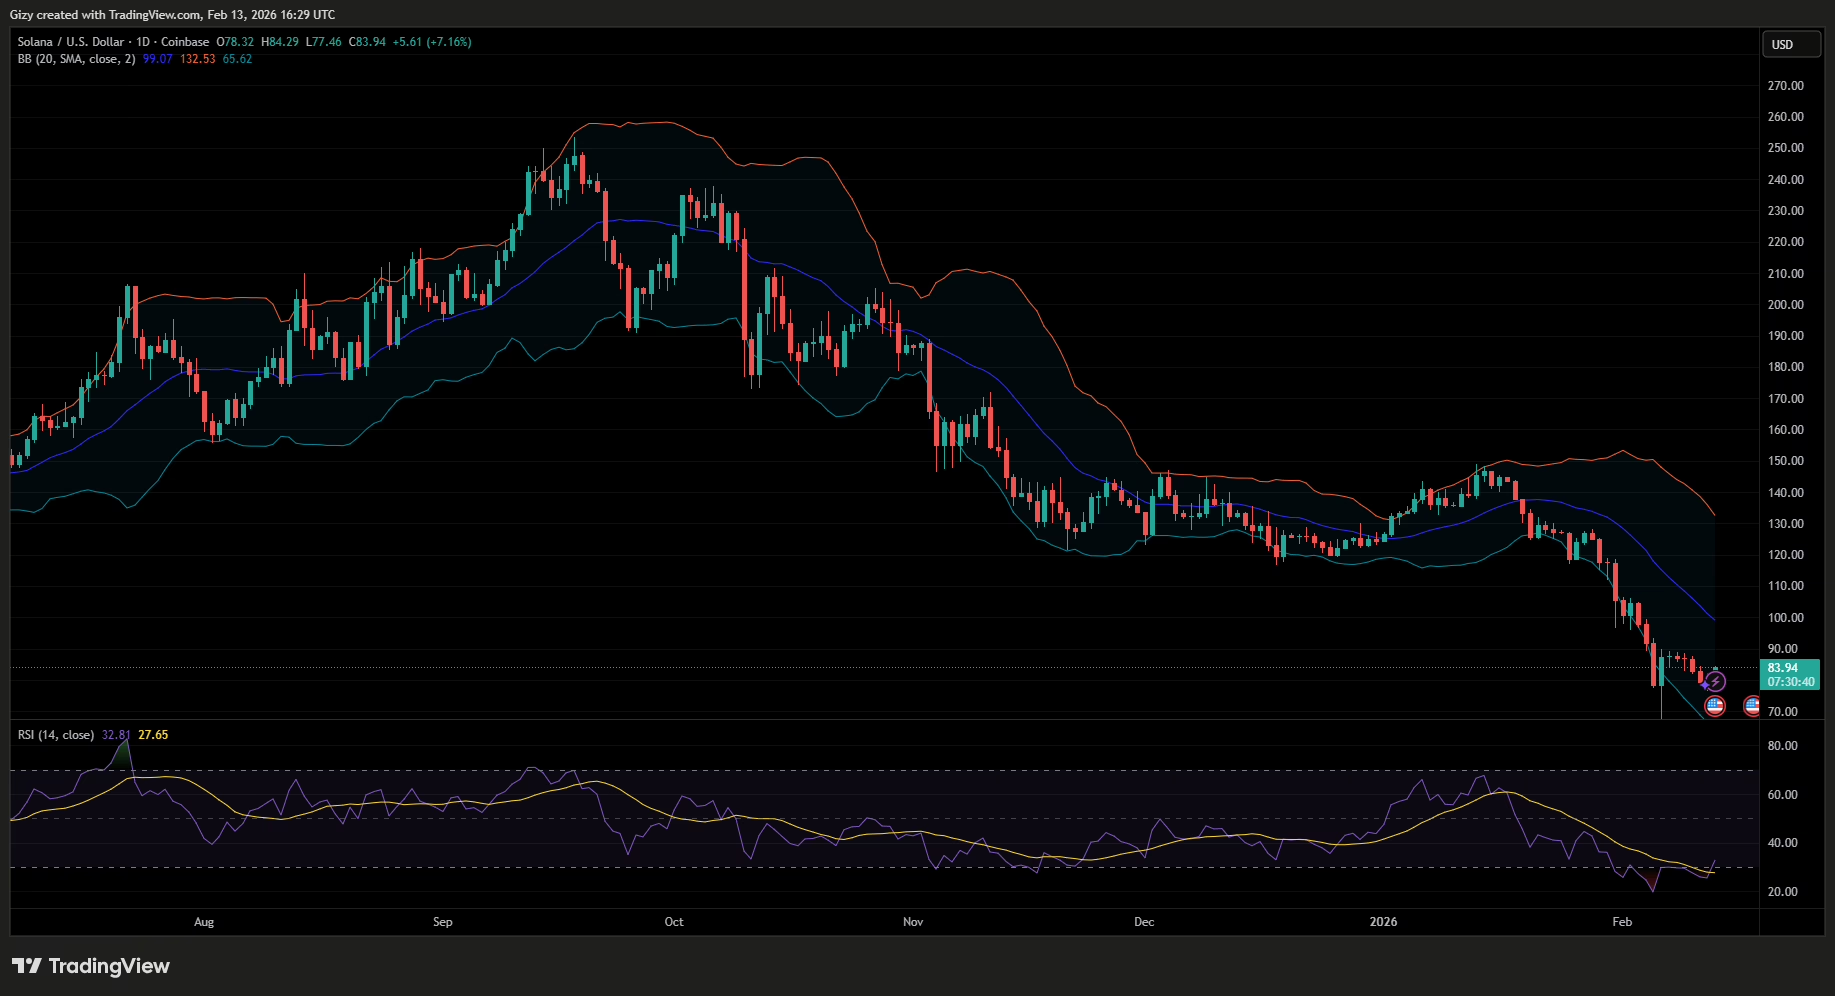
However, breaking it will certainly trigger a move to the $88 resistance. The 1-day chart shows that Solana has failed to break this key level over the last seven days.
Nonetheless, indicators suggest that the breakout may happen next week. For example, the moving average convergence divergence currently prints buy signals. The 12- and 26-EMAs are closing the gap and edging toward an intersection. The crossover will no doubt signal massive increases ahead.
Additionally, Solana is still trading below bollinger’s middle band. It is due for a rebound per the metric, which may come next week if the buyer maintains the current momentum.
Aside from the BB and MACD, the relative strength index is also positive. It dropped below 30 last week and remained oversold until Thursday. Currently at 31, the indicator points to room for further price increases.
Beyond the indicators, there are other positive signs of further increases. ETFs, for example, are seeing better performance this week than they did previously. Since Monday, the investment fund tied to Solana has seen a net inflow of $11.7 million, with the largest inflow on Tuesday.
Get Trending Crypto News as It Happens. Follow CoinTab News on X (Twitter) Now


